Applying and Interpreting Functions
Story
Amy's parents are buying her her first cell phone. The employee at the cell phone store tells Amy's parents that it will cost .05 cents for each minute she talks on the phone and will cost .02 cents per text she sends. Graph the plan Amy's parents has bought her.
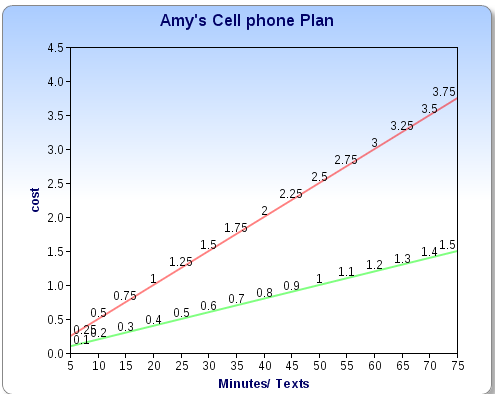
In the graph the red line represents the number of minutes Amy talks on the phone and the green line represents how much each text Amy sends costs.
Key features of the graph are the always increasing lines. These lines will never dip or bend or straighten out because they are linear and the cost of the minutes and texts is constant. The lines will also never intersect because based on what we see here they are going away from each other. This graph is increasing because when you look left to right the graph is going up. We can say the graph is increasing (-∞,∞) and it is not decreasing at all. This is a positive line because it is going up when we look at it from left to right.
The domain here is (-∞,∞) because the graph is linear and it represents that you can put in any number and get an output.
The rate of change here depends on what line you are looking at. The red line represents the number of minutes Amy talks and it goes up at intervals of .05 cents per minute. In the graph it looks like it goes up at intervals of .25 cents but that is only because the x-axis is going at intervals of 5. The green line represents how much each text Amy sends costs and it goes up at a rate of .02 cents per text. In the graph it looks like it goes up at rate of .10 cents but that is only because of the x-axis is going at intervals of 5.
